IKKI slogan
Standard Deviation คืออะไร ค่าความเบี่ยงเบียน มาตรฐาน

Hi, for those who came into this post by purpose or accidentally. I really have no experience in this engineering because I just started to get into the engineer thingy 😀  (PS. I never studied engineer T_T)

So what you will be reading is just a summary of something like my learning diary.  Let’s learn together and correct me if I am wrong at some point 🙂 

Chapter 1 – SPC : Standard Deviation

Today, it was started by a simple question that most people already knew. “What is average?” (sum of all divided by total number), but that’s not it for engineer XD What I learned today is beyond something like that (sounds scary, right? :p). It’s called SD, or standard deviation.

First of all, you and I need to clarify first what the standard deviation and mean. For example, if you shoot to target where the average is, And from the average, how much is the standard deviation of each point from the mean value?

Standard Deviation คือ

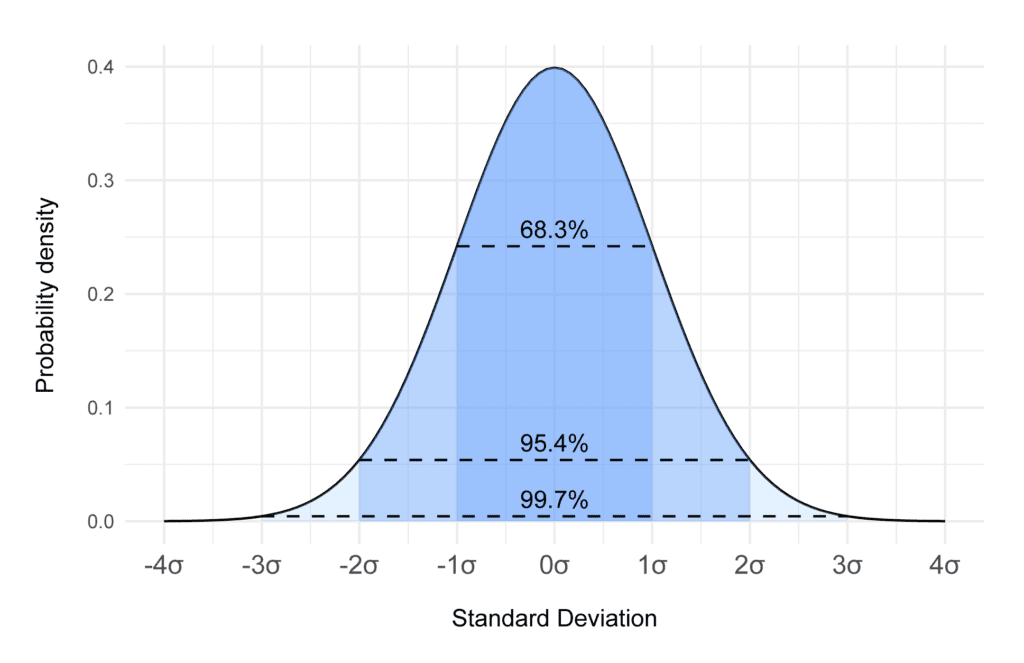
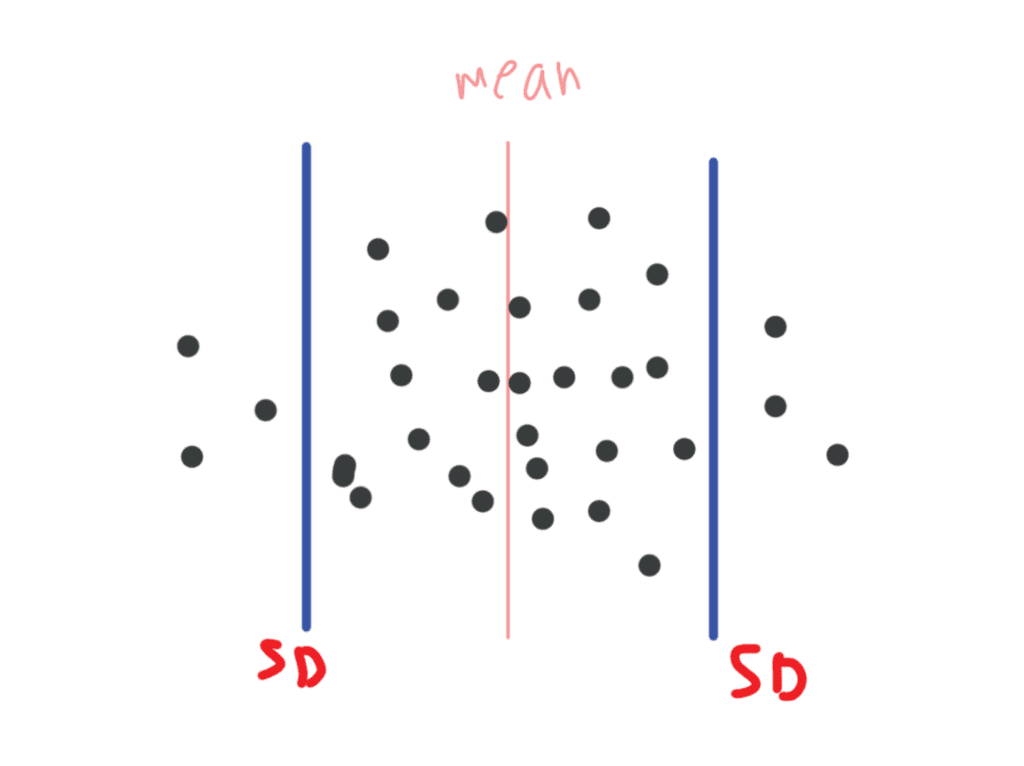
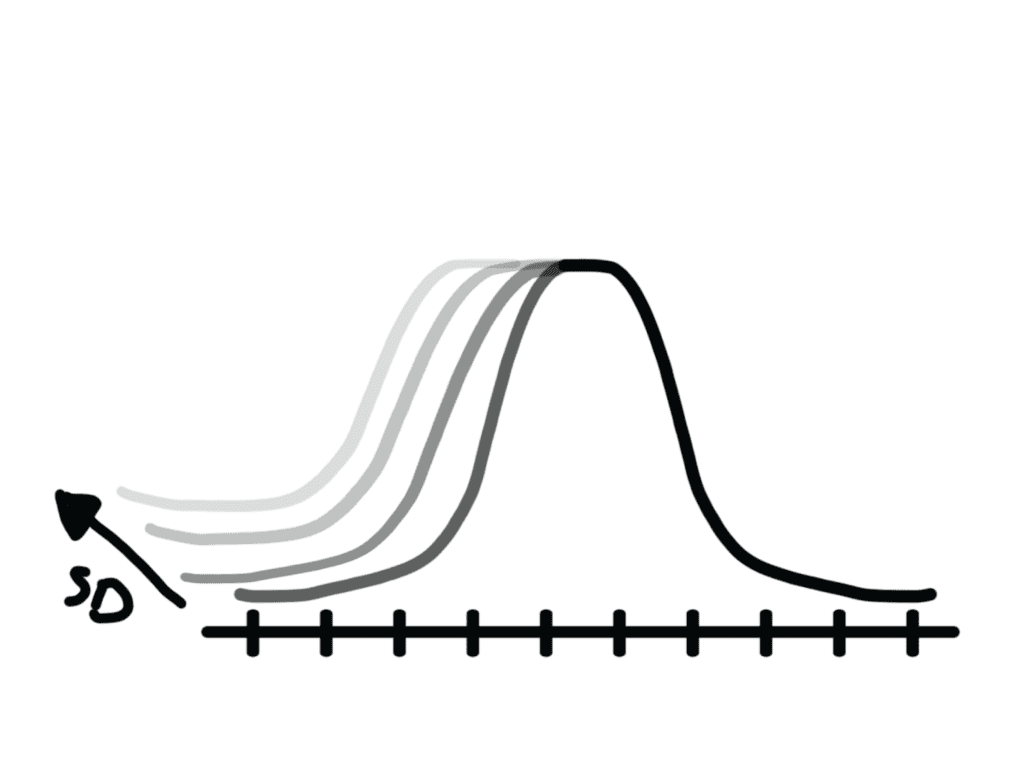
Standard Deviation to put it simple. Once you have the average number, you will try to find ± of that avg. number. 

Example. 

Object A= 10

Object B=12

Object C=14

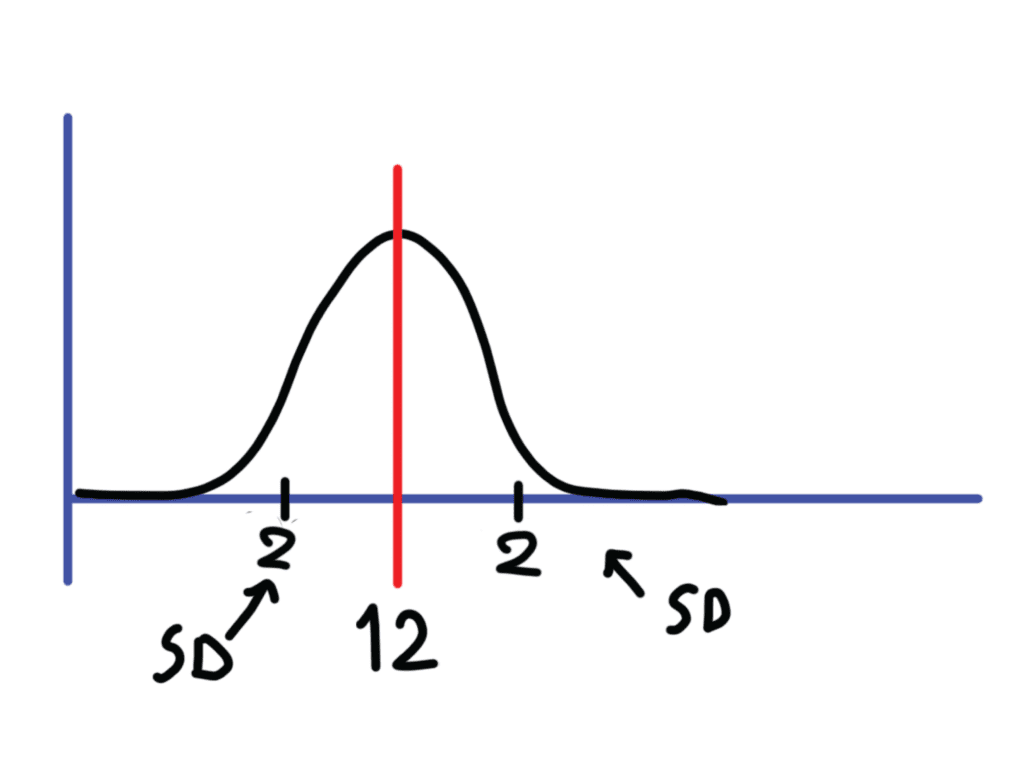
The avg. will be (10+12+14)/3= 12

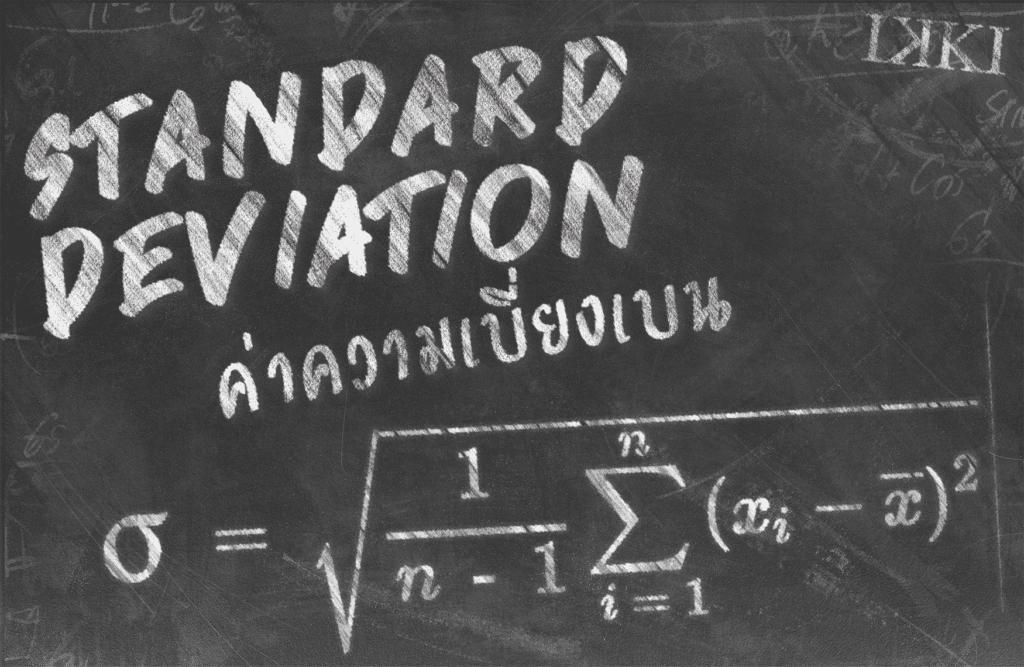
To add on the formula to find out the variance number we use the formula

สูตรหาความแปรปรวนของข้อมูล

The variance will be equal to 4

accuracy precision รูป
Accuracy and precision can be used with Standard Deviation

And from variance value 1.33 add square root to it….Standard deviation will be = 2

Here goes the formula

การหาค่าความเบี่ยงเบียนมาตรฐาน

The graph sample of deviation >>>>

กราฟ ค่าความเบี่ยงเบน
ตัวอย่างกราฟ ของค่าเบี่ยงเบียนมาตรฐาน

Are you confused? Even though I am writing…. I am still super confused, haha, and that leads to what I am going to say next…how to apply this standard deviation to engineering and industry thingy.

There will be measuring at all times during the production of one part or product. Imagine you have 100 values and want to see the value in a number, not the visual. Your eyes will definitely burn.

Let demonstrate on whiteboard like a teacher (chest up :P)

Graph Standard Deviation

spc diagram

Average is 12 and  ± 2

Do you wonder where it is coming from? Let me give more visual

spc diagram

The black dot is the part or product that is being measured. When it is going out of SD it would mean that product is off the quality there is something wrong

What SD graph tell you in manufacturing

อ่านกราฟ SD

Eh! Quality, produces some part is of the chart

อ่านกราฟ SD

Quality is under control. SAFE!

อ่านกราฟ SD

Wow that’s the quality the finest…. or someone didn’t do the job properly

อ่านกราฟ SD

At Least not out of quality standard.

As you can see the graph sample. Now you may understand a bit more of how the Quality Check from the graph itself. During the operation check, the Quality guy can instantly tell from the graph. Simply based on SD value, the higher the SD value, the greater the swing in quality end-product.

Now I understand it better… So what about you…. To make working more efficiency in SPC industry follow this link to software solution to SPC


อ่านกราฟ SD ที่มากขึ้น